MVEN10 Risk Assessment in Environment and Public Health
Author
Ullrika Sahlin
Exercise overview
Work in groups of 2-3
Background
Risk assessments are made using available data (+ evidence and expert knowledge).
Observations of the real world are useful to inform (or with a fancy word - calibrate) assessment models. It is important to consider how data have been collected and it is related to the system being studied.
Purpose
To get a feeling for collecting and managing data for further analysis
To practice summarising data by its descriptive statistics
Content
make observations and save them in a spreadsheet
load data to R
summarise by statistics and suitable graph
make a report
Duration
70 minutes
Reporting
Write a report using a qmd document and upload it on the discussion forum in canvas.
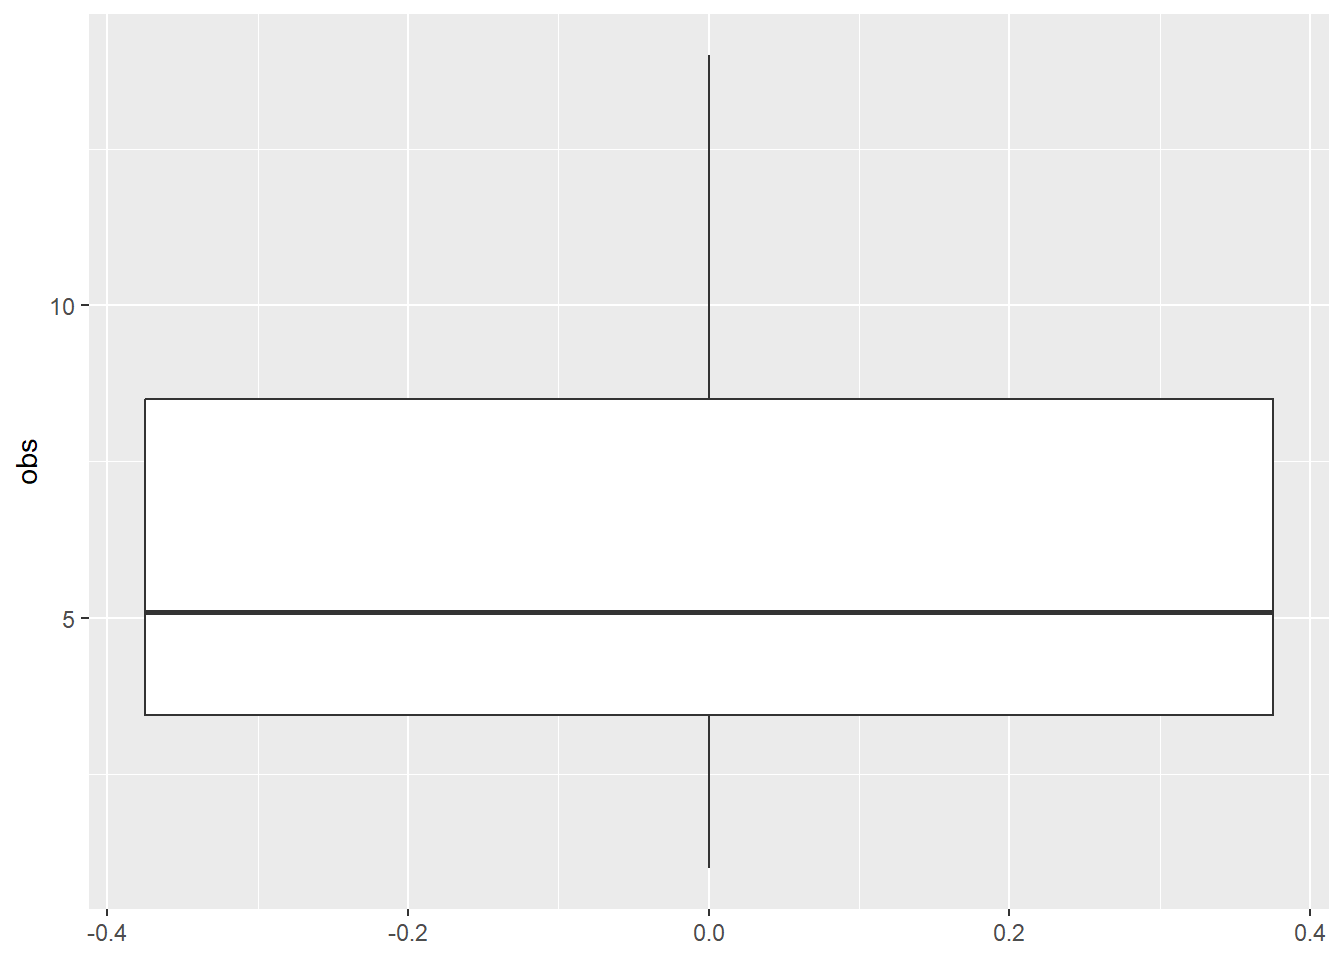
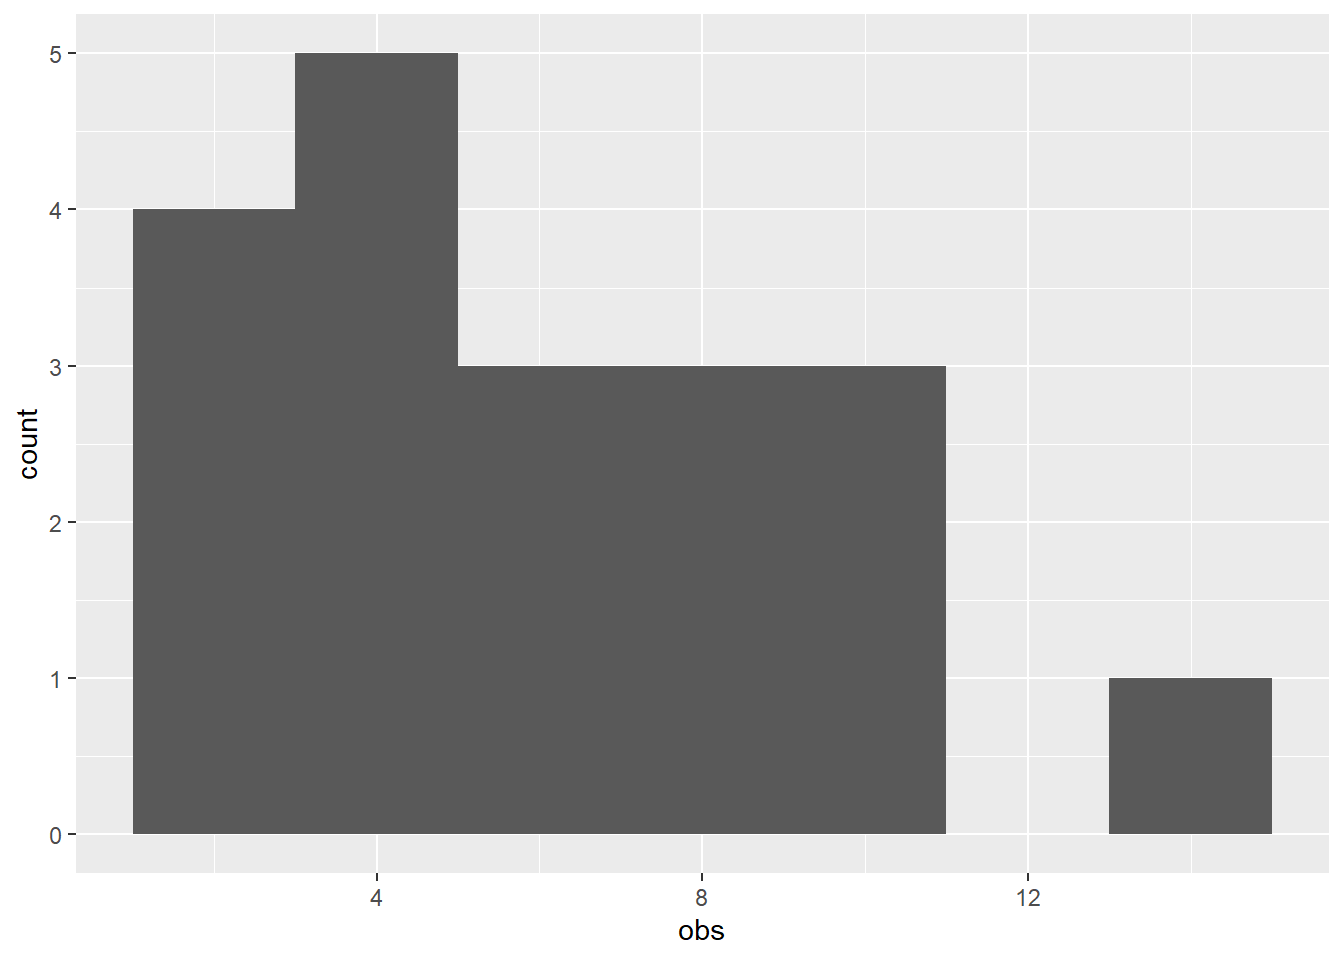
The report should contain the name of the authors, a boxplot, a histogram, the size, mean, median, min, max, and the quantiles: P5, P25, P75 and P95, of the data sample.
There is no need to make the report look fancy, the important thing is that you produce a report.
Collect observations
Collect 20 observations from the alternative assigned to your group, which can e.g. be:
Measure the distance between the cutted edges of randomly chosen wooden bricks in the box placed in the lecture room.
Weight fallen apples. There are lots around the Ecology building.
Count the number of cars passing in one direction during 30 seconds intervals. Do it on Tornavägen by the bridge over the tram.
Same as above, but measure instead the time between cars passing in one direction until you have 20 cars.
Open a new spreadsheet and call it “ex_obs_yournames.xlsx”, where “yournames” is altered to your names.
Call the first sheet metadata and the second sheet one data.
Feed in the observations in the data sheet. Give them a name on the top of the column. I call mine “obs”.
In the metadata sheet, add information on how and when data was collected and by whom. If the data is discrete or continuous. If applicable, what unit used. Any other relevant information.
Descriptive statistics
Load your data into R.
The code below loads a package for reading Excel files. If you don’t have this, you will be asked to install it.
The function read_excel directs to the Excel file and which sheet to read from.