Background
Conjugate models are very useful even today, but for relatively simple problems.
Task 1
Test an hypothesis using conjugate model. How sensitive is the conclusion from the choice of prior?
Let \(\lambda\) be the average number of goals scored in a Women’s World Cup game. We’ll analyse \(\lambda\) by a Gamma-Poisson model where data \(Y_i\) is the observed number of goals scored in a sample of World Cup games
Specify the model
Plot and summarize our prior understanding of \(\lambda\).
Why is the Poisson model a reasonable choice for our data
\(Y_i\)?
Use the wwc_2019_matches data from fivethirtyeight
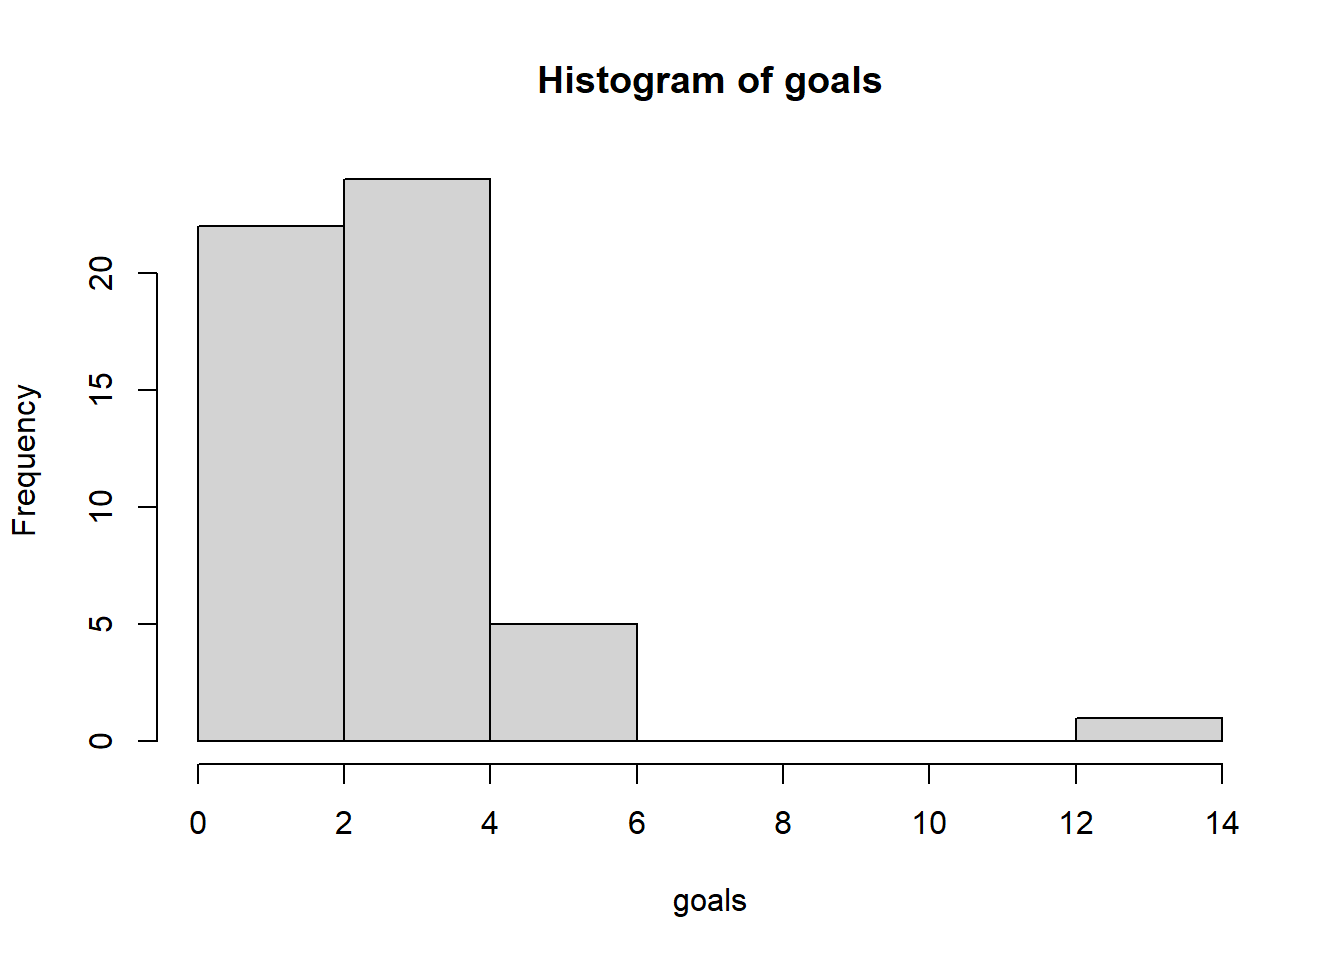
The wwc_2019_matches data includes the number of goals scored by the two teams in each 2019 Women’s World Cup match. We summed the scores by the two teams per game, made a histogram and calculated some summary statistics:
Some larger datasets need to be installed separately, like senators and
house_district_forecast. To install these, we recommend you install the
fivethirtyeightdata package by running:
install.packages('fivethirtyeightdata', repos =
'https://fivethirtyeightdata.github.io/drat/', type = 'source')
   Min. 1st Qu.  Median    Mean 3rd Qu.    Max.
  0.000   2.000   3.000   2.808   3.000  13.000
- Make a test if the average number of goals scored in a Women’s World Cup game is less than 1.8.
Task 2
Use conjugate models to construct probability intervals for the results from a clinical trial and compare to a published meta-analysis.
Lancet paper
31142-9/asset/b966c770-af7d-4424-a04a-556cef203d13/main.assets/gr4_lrg.jpg)
A relative risk (RR) is a ratio of the probability of an event occurring in the exposed group versus the probability of the event occurring in the non-exposed group.
Reproduce the probability interval for a RR from the forest plots tables e.g. Scales et al 2003
Calculate a probability interval for one of the studies for which the RR is not calculable, e.g. Hall et al 2014