Predictive Performance
BADT
Learning goals
- Describe how prior and data influence posterior distributions
- Apply this understanding to interpret posterior predictions across different scenarios with varying priors (flat, informed) and data (sparse, abundant)
- Reflect on the ethical and practical implication of prior choices in modeling
- Describe the purpose of evaluating predictive performance
- Describe why evaluation of predictive performance is necessary for model validation, generalization and avoiding overfitting
- Describe the difference between in-sample and out-of-sample evaluation of predictive performance
- Reflect on the limitations of relying solely on predictive performance for decision making
- Describe categories of predictive performance metrics
- Describe the key difference between the categories
- Describe Bayesian predictive measures
The rationale for model evaluation and comparison
Model evaluation: how good is this model?
Goodness-of-fit: Is the model good enough (for the data)?
Predictive performance: Can the model make good predictions for new data?
Model comparison: Is the model better than other models?
Two critical issues:
Lack of fit
Overfitting
Generalization with context
Overfitting
In MCMC, overfitting, i.e., having more parameters than needed may cause three things:
The predictions are too good to be true
Divergence statistics are bad
Posteriors for individual parameters have huge dispersion
Identifiability issue: MCMC can’t tell influence on the likelihood come from which parameter
Predictive performance metrics for Bayesian models
Bayesian models have a full posterior distribution already!
With sufficient computing power, no reason not to use full predictive distribution.
Expected log predictive density (elpd)
\[ elpd(y,\tilde{y}_i) = \sum^n_{i=1}{\int{p_t (\tilde{y}_i)\log \ p(\tilde{y}_i |y)\ d \tilde{y}_i}} \]
elpd can be used for computing Widely-applicable information criterion or leave-one-out cross validation.
Expansion reads:
Generalization with practical context
Scope of evaluation: in-sample vs out-of-sample
A model to predict ice cream consumption based on swimming activity.
If the model is trained on survey data by people in Lund in summer, will the predictions apply to people in Malmö winter?
Will the predictions apply to people in Qatar (in desert) in summer?
Out-of-sample evaluation
Cross-validation
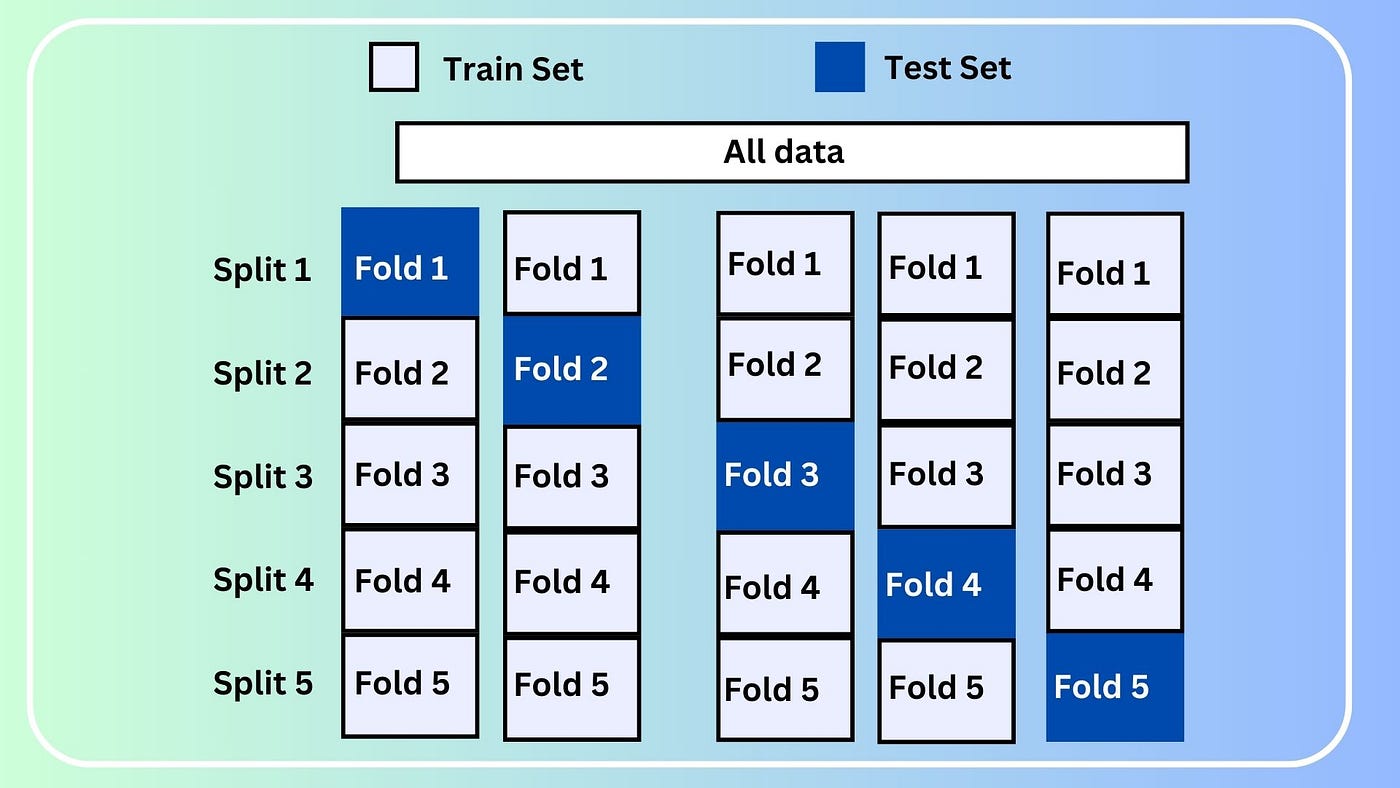
True remedy to out-of-sample prediction problem is to improve the representativeness of sampling protocol. - Not necessarily related to sample size - Be aware of bias in sampling protocol and reduce the bias
Category of predictive performance metrics
| Category | Description | Example |
|---|---|---|
| Central tendency | Considers ONLY the mean distance between observed and predictive values | Mean Rooted Squared Errors |
| Incomplete uncertainty | In addition to central tendency, also considers uncertainty from the spread (variance) | Ranked Probability Score |
| Complete uncertainty | Full predictive density distribution | Expected Log Predictive Density |